Subgroup detection in linear growth curve models
Citation
Marjolein Fokkema, Achim Zeileis (2023). “Subgroup Detection in Linear Growth Curve Models with Generalized Linear Mixed Model (GLMM) Trees.” arXiv.org E-Print Archive arXiv:2309.05862 [stat.ME]. doi:10.48550/arXiv.2309.05862
Abstract
Growth curve models are popular tools for studying the development of a response variable within subjects over time. Heterogeneity between subjects is common in such models, and researchers are typically interested in explaining or predicting this heterogeneity. We show how generalized linear mixed effects model (GLMM) trees can be used to identify subgroups with differently shaped trajectories in linear growth curve models. Originally developed for clustered cross-sectional data, GLMM trees are extended here to longitudinal data. The resulting extended GLMM trees are directly applicable to growth curve models as an important special case. In simulated and real-world data, we assess the performance of the extensions and compare against other partitioning methods for growth curve models. Extended GLMM trees perform more accurately than the original algorithm and LongCART, and similarly accurate as structural equation model (SEM) trees. In addition, GLMM trees allow for modeling both discrete and continuous time series, are less sensitive to (mis-)specification of the random-effects structure and are much faster to compute.
Software
https://CRAN.R-project.org/package=glmertree
Illustration
As an example, heterogeneity of science ability trajectories among a sample of 250 children is analyzed. The data are from the Early Childhood Longitudinal Study-Kindergarten (ECLS-K) class of 1998-1999 in the USA. Assessments took place from kindergarten in 1998 through 8th grade in 2007. Here we focus on assessments from kindergarten, 1st, 3rd, 5th, and 8th grade. The time since kindergarten was scaled to the number of months to the power of 2/3 in order to obtain approximately linear trajectories.
A linear mixed-effect model tree is used to detect heterogeneity in a linear model for the growth of science ability over time. This employs a random intercept for each individual in order to account for the longitudinal nature of the data. The tree tests for differences in the baseline science abilities (i.e., the fixed-effect intercepts of the growth curve models) as well as the growth over time (i.e., the corresponding fixed-effect slopes), using eleven socio-demographic and behavioral characteristics of the children, assessed at baseline, as potential splitting variables.
The plot below shows the resulting tree which identifies socio-economic status (SES), gross motor skills (GMOTOR), and internalizing problems (INTERN) as the splitting variables. The x-axes represent the number of months after the baseline assessment, y-axes represent science ability. Gray lines depict observed individual trajectories, red lines depict average growth curve within each terminal node, as estimated with a linear mixed-effect model comprising node-specific fixed effects of time and a random intercept with respect to individuals. The table presents numerical estimates of fixed intercepts and slopes.
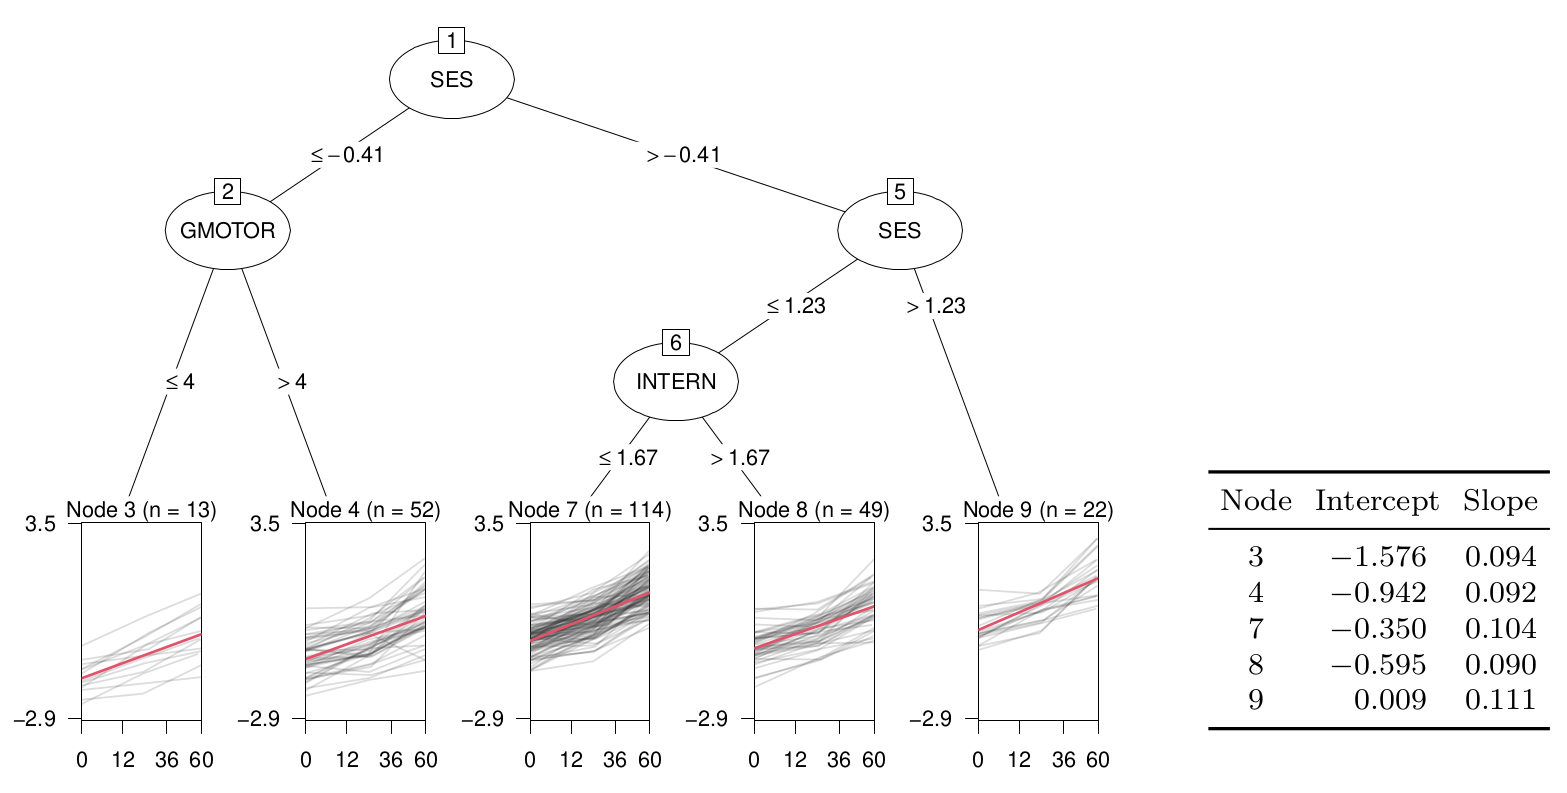
Five subgroups are identified, corresponding to the terminal nodes of the tree, each with a different estimate of the fixed intercept and slope. Groups of children with higher SES also have higher intercepts, indicating higher average science ability. The group of children with lower SES (node 2) is further split based on gross motor skills, with higher motor skills resulting in a higher intercept. The group of children with intermediate levels of SES (node 6) is further split based on internalizing problems, with lower internalizing problems resulting in a higher intercept. The two groups (or nodes) with higher intercepts also have higher slopes, indicating that children with higher ability also gain more ability over time.